Data artwork
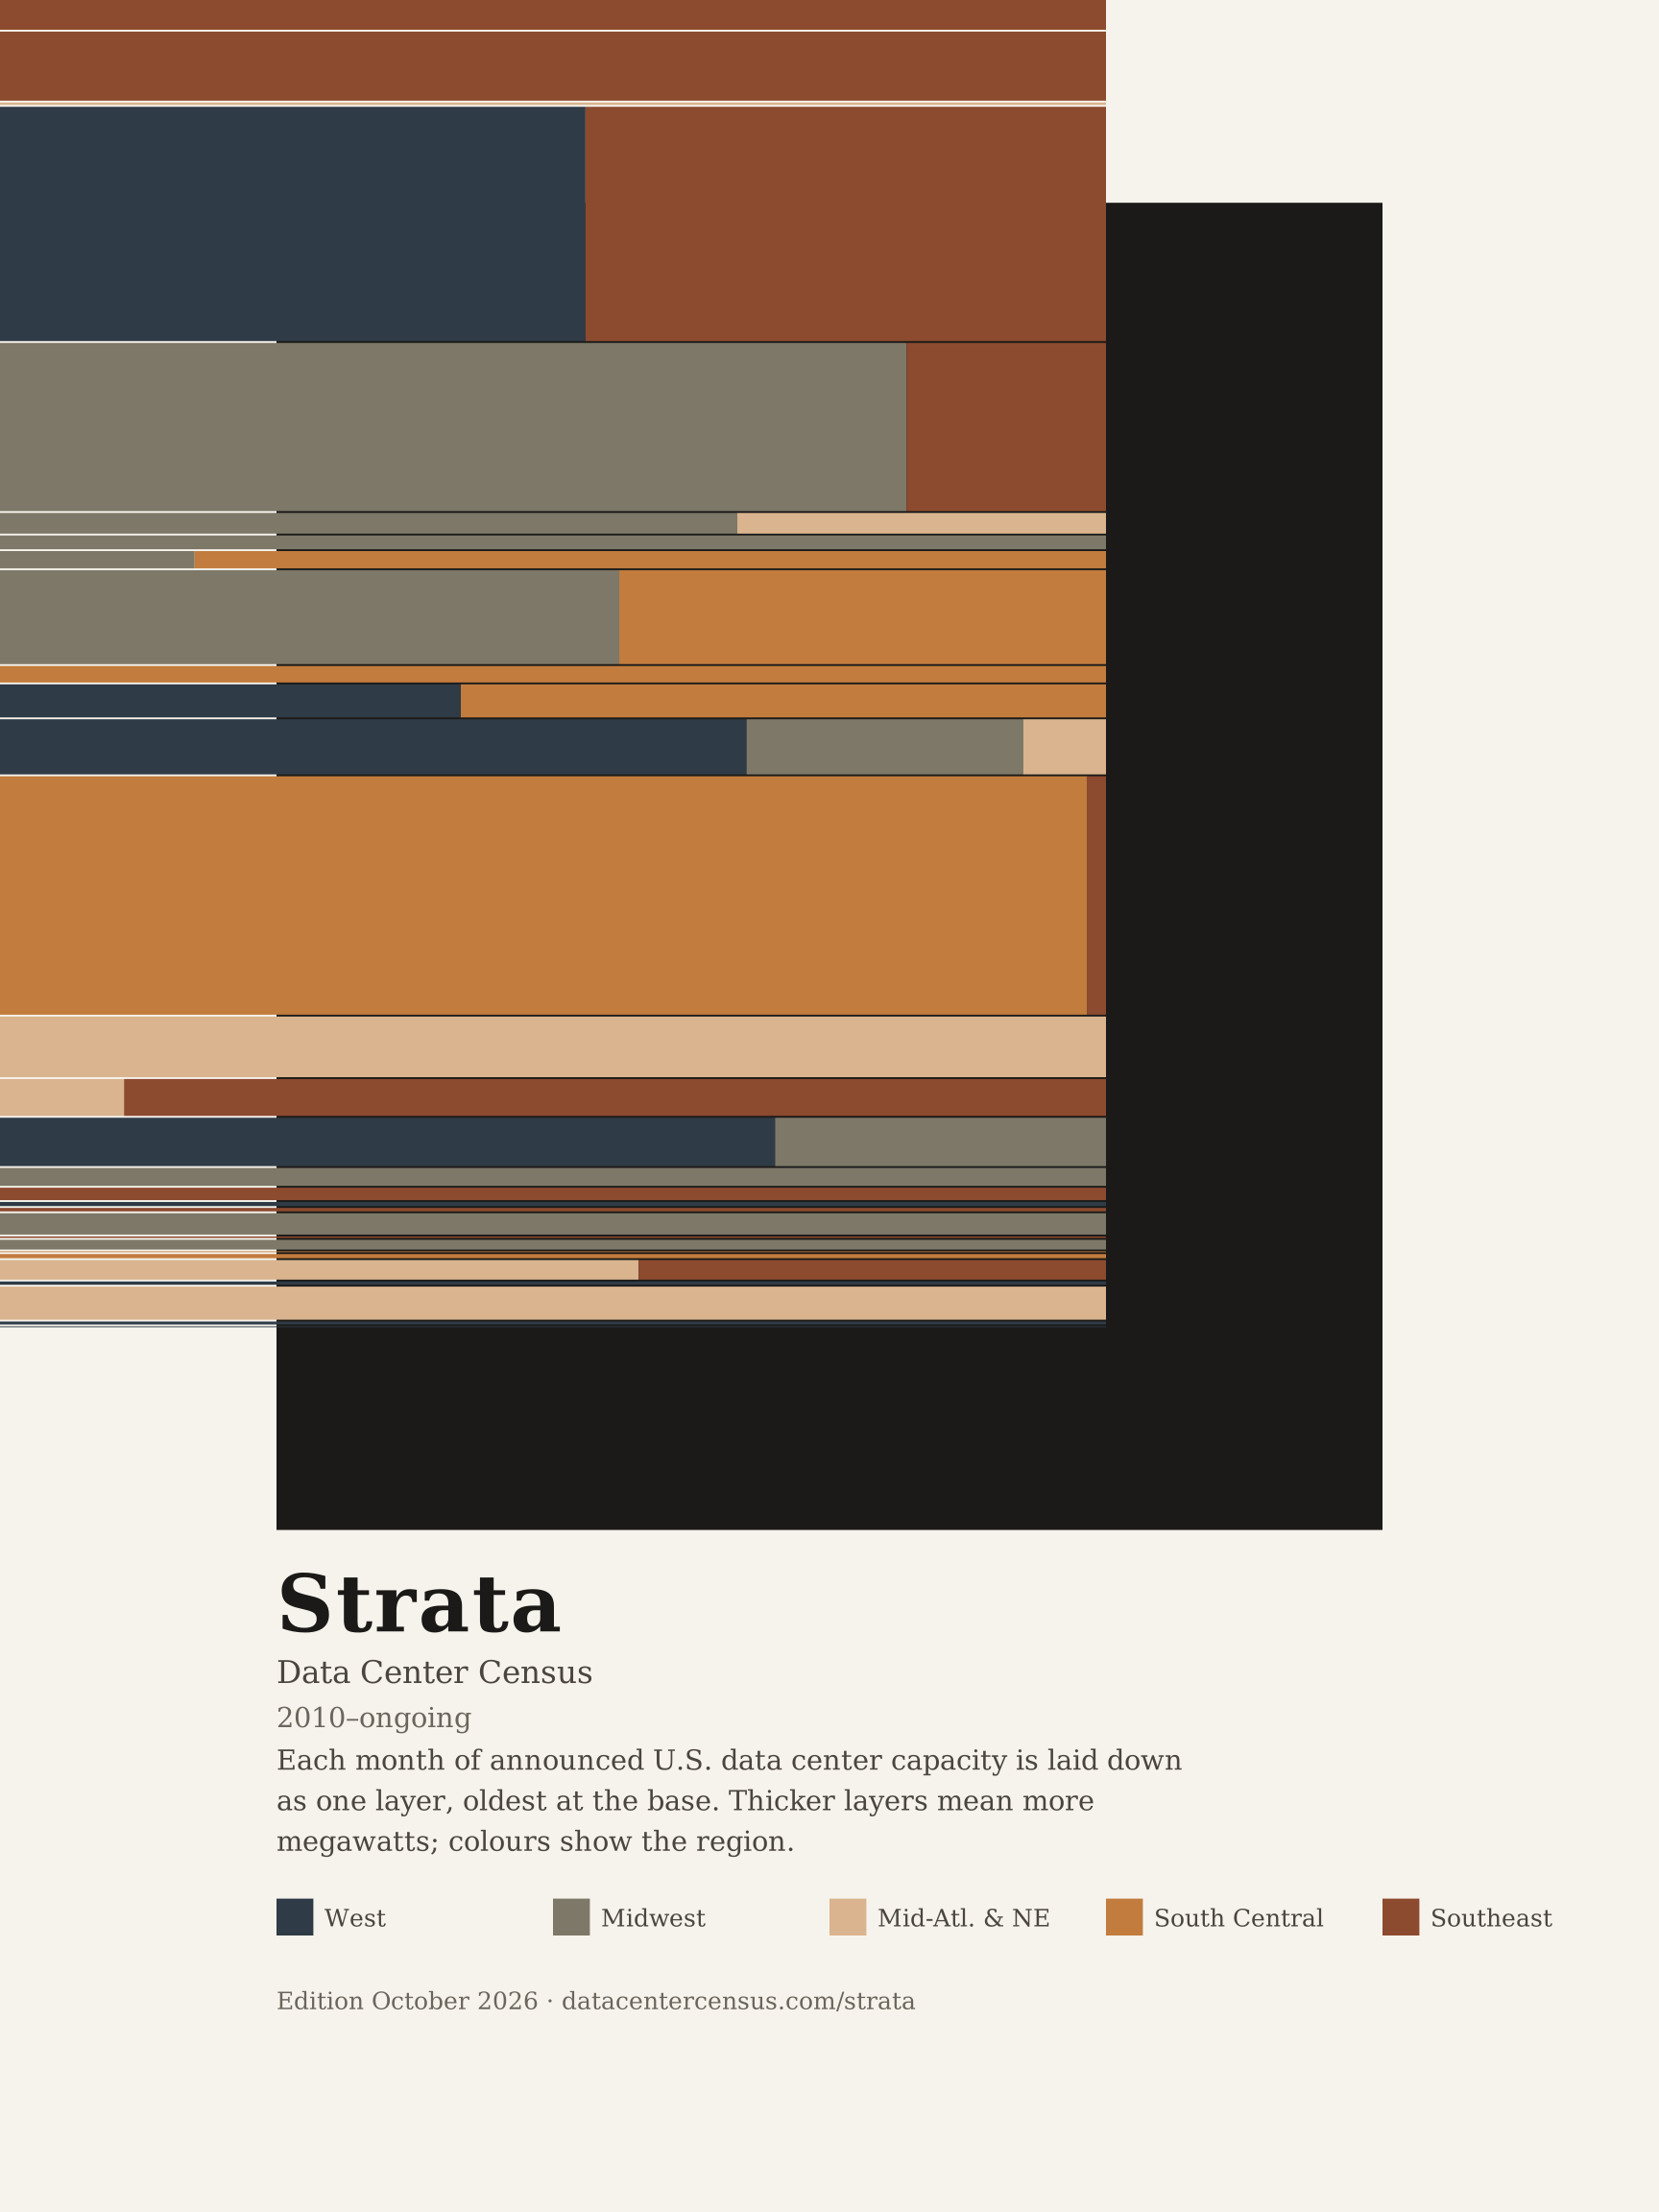
Data center capacity announced, month by month
In September 2026, 2,160 MW of new U.S. data center capacity was announced across 1 project; Southeast led with 2,160 MW. 56 other projects with a stated capacity are not drawn yet because they have no sourced announcement date.
How much data center capacity is announced each month?
The table gives the megawatts (MW) of capacity announced in each month and how it splits by region. The current month, October 2026, is partial. Each completed month links to its own edition, which lists the projects announced that month.
Newest first. Region columns are MW.
| Month | MW announced | Projects | West | Midwest | Mid-Atl. & NE | South Central | Southeast |
|---|---|---|---|---|---|---|---|
| September 2026 | 2,160 | 1 | 0 | 0 | 0 | 0 | 2,160 |
| July 2026 | 5,010 | 2 | 0 | 0 | 0 | 0 | 5,010 |
| May 2026 | 177 | 1 | 0 | 0 | 177 | 0 | 0 |
| April 2026 | 17,000 | 2 | 9,000 | 0 | 0 | 0 | 8,000 |
| March 2026 | 12,200 | 2 | 0 | 10,000 | 0 | 0 | 2,200 |
| February 2026 | 1,500 | 2 | 0 | 1,000 | 500 | 0 | 0 |
| December 2025 | 1,000 | 1 | 0 | 1,000 | 0 | 0 | 0 |
| November 2025 | 1,250 | 2 | 0 | 220 | 0 | 1,030 | 0 |
| October 2025 | 6,817 | 5 | 0 | 3,817 | 0 | 3,000 | 0 |
| September 2025 | 1,200 | 1 | 0 | 0 | 0 | 1,200 | 0 |
| August 2025 | 2,400 | 2 | 1,000 | 0 | 0 | 1,400 | 0 |
| July 2025 | 4,000 | 3 | 2,700 | 1,000 | 300 | 0 | 0 |
| June 2025 | 17,300 | 2 | 0 | 0 | 0 | 17,000 | 300 |
| April 2025 | 4,400 | 1 | 0 | 0 | 4,400 | 0 | 0 |
| March 2025 | 2,675 | 3 | 0 | 0 | 300 | 0 | 2,375 |
| February 2025 | 3,510 | 2 | 2,460 | 1,050 | 0 | 0 | 0 |
| January 2025 | 1,300 | 1 | 0 | 1,300 | 0 | 0 | 0 |
| December 2024 | 900 | 1 | 0 | 0 | 0 | 0 | 900 |
| August 2024 | 300 | 1 | 300 | 0 | 0 | 0 | 0 |
| June 2024 | 250 | 1 | 0 | 0 | 0 | 0 | 250 |
| May 2024 | 1,550 | 1 | 0 | 1,550 | 0 | 0 | 0 |
| April 2024 | 110 | 1 | 0 | 0 | 0 | 0 | 110 |
| March 2024 | 708 | 1 | 0 | 708 | 0 | 0 | 0 |
| January 2024 | 60 | 1 | 0 | 0 | 0 | 60 | 0 |
| November 2023 | 300 | 1 | 0 | 0 | 0 | 300 | 0 |
| August 2023 | 1,420 | 2 | 0 | 0 | 820 | 0 | 600 |
| May 2023 | 240 | 1 | 240 | 0 | 0 | 0 | 0 |
| June 2021 | 2,400 | 1 | 0 | 0 | 2,400 | 0 | 0 |
| January 2019 | 212 | 1 | 212 | 0 | 0 | 0 | 0 |
| March 2010 | 65 | 1 | 65 | 0 | 0 | 0 | 0 |
Months with no project that states a capacity are left out. The thickest layers are usually single very large campuses, so one project can move a month.
Which regions are growing fastest?
This compares the MW announced in the last six completed months with the six months before. It is a small sample, so read it as a direction, not a trend line.
| Region | Last 6 months (MW) | Prior 6 months (MW) | Change (MW) |
|---|---|---|---|
| Southeast | 15,170 | 2,200 | +12,970 |
| West | 9,000 | 0 | +9,000 |
| Mid-Atlantic & Northeast | 177 | 500 | -323 |
| South Central | 0 | 4,030 | -4,030 |
| Midwest | 0 | 16,037 | -16,037 |
How is this made?
Strata is drawn by the site build from the project records, so it changes whenever a record does. A layer's thickness is the sum of the stated capacity of the projects announced that month, in MW. Colours split each layer by the state where the project sits.
- Which projects. 47 projects with a sourced announcement date are drawn; 56 projects with a stated capacity are waiting for a sourced announcement date; 78 projects state no capacity. No capacity or date is estimated.
- Which month. A project sits in the month of its announcement: the earliest date a public source reports it, taken from a timeline event and cited source on the record. A project is never placed by when the Census recorded it.
- Which capacity. The capacity on the record: the total campus figure where one is stated, else the IT load. Sources differ on what “capacity” means, so the project page gives the wording.
- Regions. The Census groups states into five regions for this page only: West (AK, AZ, CA, CO, HI, ID, MT, NM, NV, OR, UT, WA, WY); Midwest (IA, IL, IN, KS, MI, MN, MO, ND, NE, OH, SD, WI); Mid-Atlantic & Northeast (CT, DC, DE, MA, MD, ME, NH, NJ, NY, PA, RI, VT); South Central (AR, LA, OK, TX); Southeast (AL, FL, GA, KY, MS, NC, SC, TN, VA, WV).
- Reading it. Thin layers can be under one pixel tall. Use the table above or the downloads for exact values.
Related: boom timelapse, charts, capacity meter, methodology.
Past monthly editions
Each completed month is frozen into an edition: the artwork up to that month, that month's table and the projects announced in it.
- September 2026
- July 2026
- May 2026
- April 2026
- March 2026
- February 2026
- December 2025
- November 2025
- October 2025
- September 2025
- August 2025
- July 2025
- June 2025
- April 2025
- March 2025
- February 2025
- January 2025
- December 2024
- August 2024
- June 2024
- May 2024
- April 2024
- March 2024
- January 2024
- November 2023
- August 2023
- May 2023
- June 2021
- January 2019
- March 2010
Download or embed Strata
Poster (SVG, 18 × 24 in) Artwork (SVG) Data (CSV) Data (JSON)

Free to reuse under CC BY 4.0 with credit to Data Center Census and a link to this page. To embed it, paste this snippet; it links back here.
<a href="https://datacentercensus.com/strata"><img src="https://datacentercensus.com/strata/strata.svg" width="300" height="360" alt="Strata: U.S. data center capacity announced by month, by Data Center Census"></a>
<p>Strata by <a href="https://datacentercensus.com/strata">Data Center Census</a></p>
Cite this page
Last updated Oct 29, 2026. Figures may change as records are updated — include the date you retrieved them.
| APA | Data Center Census. (2026). Strata: data center capacity announced by month. Retrieved from https://datacentercensus.com/strata |
|---|---|
| MLA | “Strata: data center capacity announced by month.” Data Center Census, Oct 29, 2026, https://datacentercensus.com/strata. |
| Link | https://datacentercensus.com/strata |
Republishing a figure or table? Attribute it to Data Center Census with a link to this page. The underlying data is downloadable as JSON and CSV; the press kit has standing figures and contact details.